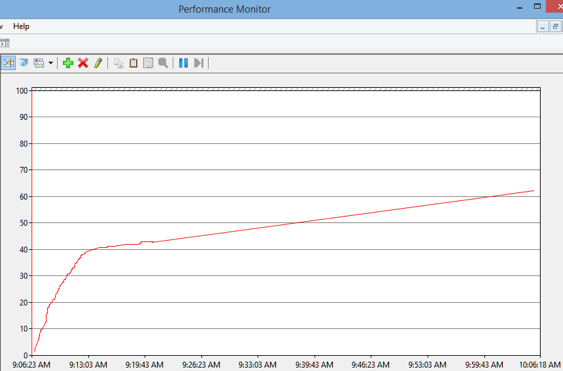
An issue that inevitably crops up in long-running, complex software systems is memory use. In the worst cases it manifests as a crash after several hours or days of running when the software has consumed all available memory.
Another inevitability is that these out-of-memory crashes are found very late in the development cycle, just prior to a delivery date. Or, worse, they are found after delivery. Given the fact that the crashes take hours or days to occur because the testing cycles are very long, they cause a lot of stress for the development team and frequently delay delivery.
The rest of this blog contains a proposed process to find these issues sooner in the development process and some tools to help the developer investigate memory use.
Early and continuous testing of the software system is the key to avoiding delivery of memory leaks. As soon as possible a dedicated system should be set up for endurance testing. The software should be built in debug mode, but it is not necessary to run it in a debugger. Preferably, for equipment control software, this would use a simulator for the hardware. This should be done as soon as there is enough of the software developed to be able to perform any significant functionality in a repetitive manner. This test can evolve as more of the software is developed with functionality being added to the test as it becomes available. For semiconductor equipment control software, a logical test would be to perform wafer cycling as this would exercise a good majority of the software.

This endurance test should be kept running during development, right up to delivery. The computer running the endurance test should be configured to collect Windows crash dumps for the software application(s) and have Windows Performance Monitor configured to monitor Private Bytes for the application(s), https://msdn.microsoft.com/en-us/library/windows/hardware/ff560134(v=vs.85).aspx. The test should be checked daily to see how the Private Bytes memory use has changed. If the application has crashed, then the crash dump .DMP file can be collected and analyzed. Visual Studio can be used to open the .DMP file for analysis on the developer’s computer.
The endurance test should be maintained and updated as the software is updated. However, since run time is important for this test, consider only updating it on a weekly basis unless the update is to fix an issue that caused the test to crash.
If the endurance test shows that the Private Bytes for the application increases steadily with no signs of levelling off, then the application probably has a memory leak.
For C++ programs, Microsoft’s UMDH memory dump utility is very useful for tracking down what allocations are occurring in the application, https://msdn.microsoft.com/en-us/library/windows/hardware/ff560206(v=vs.85).aspx. The concept is to take two or more memory snapshots and analyze the differences to see what new objects have been created. Remember to have the software built in debug mode so full debug information is available in the memory dumps.
For .NET programs, newer versions of Visual Studio have built in memory profiling, https://msdn.microsoft.com/en-us/library/dd264934.aspx.
There are third party memory analyzers on the market that some have found to be useful. Most of these will report numerous false positives that the developer will have to wade through to get to the real leaks. Most third party memory analyzers for .NET seem to frequently report false positives for COM objects.
The tools just provide the developer a location to review the code for leaks. It still requires diligence and expertise on the part of the developer to analyze the information and find the cause of the leak. Seldom do the tools create a treasure map with "X" marking the spot of the leak.
Having an endurance test running allows the developer to understand the memory profile of the software and watch how the profile changes as the software changes. Early detection is critical given the length of the testing cycle.♦


